Machine Learning is used in almost every aspect of our technological life. You found this video because of a machine learning algorithm that recommended it to you. Learning about it will help you learn how machines learn, but more importantly it's an interesting topic.
The code i'm going to be going over uses a python module I made, which you can find here. You can also install it with:
pip install ml-python
OR
                    git clone "https://github.com/vivek3141/ml"

                    cd ml

                    python setup.py install
I highly recommend using to learn about the algorithms, then trying other modules for better usage. If you experience an error, feel free to open an issue and I will try to resolve it ASAP. I’m assuming you have some coding knowledge, and some mathematical background. If you want to learn python, you can do so here. All the code referenced can be found here.
So what is machine learning? By definition, it’s a way for machines to learn without being explicitly programmed. For example, if you’re trying to predict if an image is a car or not, you’re not telling your program to look for certain pixel values and use if statements to predict whether it’s a car or not. You basically show your computer a bunch of images and it learns from those images what cars look like. By the way, this process is called training, and the images and whether it’s a car or not is called a dataset. It’s important to learn terminology, as when you look up help on the internet, you are able to understand what is being told.
Broadly speaking, there are three types of machine learning - supervised learning, unsupervised learning and reinforcement learning. I'll save reinforcement learning for another video. Supervised learning is where the model is given a set of data to train on. Unsupervised learning models find patterns and relationships in the data.
Supervised learning
Supervised learning consists of regression and classification. Regression is predicting something based on a few variables, like predicting the price of stocks, but classification is classifying into defined groups, like classifying a picture as a car or not.
Linear Regression
The first supervised learning model we’re going to be talking about is linear regression. If you’ve ever taken an Algebra II class, you probably know what that is. But, let’s just go over it. Let’s say you want to predict the price of petroleum based on the price of crude oil. You may gather some sample data points, with the price of crude oil and the price of petroleum. If you plot them, it looks like we could fit a line that would let us roughly predict the price of petroleum.
But, how would we do that? Let’s get some terminology out of the way. Our model, or out hypothesis, which I’ll call $h(x)$ is defined as $0+1x$. $x_i$ and $y_i$ refer to the ith point in our dataset. First, let's think about how we can calculate our error, or how bad our model is. We can take the distance between our line and the actual point and average it over all data points. When this is being done, we typically use a square rather than an absolute value, and you can find out why here. So, our error function, which is called a cost function or $J(\Theta_0, \Theta_1)$, takes in 2 numbers for $Theta_0$ and $Theta_1$ and outputs a number that shows how bad our model is. The end goal is to minimize this function. People who have studied calculus might get a ding in their head, and students who have studied multivariable calculus might know that you could set the $\nabla J = 0$ and calculate the values. However, there are a few minimizing algorithms that could be much more computationally efficient. Not to mention, calculating the partial derivatives may not always be possible if $h(x)$ is a much more complex function. The algorithm we’ll be using is called gradient descent. Basically, this is an algorithm that keeps repeating itself, until it reaches a local minimum. The way it works is taking steps in a downward direction until it reaches a local minimum. Using this algorithm we can get our values for $h(x)$. The learning rate is an important term. It describes how large the steps should be. Smaller steps could result in very slow optimization, and larger steps could miss the minimum. Picking the right learning rate is essential to getting a good model. There are many different minimizing algorithms, which are far more complex, but those could be used too.

Now, let’s go over some code. First lets import out numpy library, which is used for doing operations
on matrices. Next, we’ll import the required module from the library to do linear regression. Let’s
randomly generate our data. What this is doing is randomly generating 50 data points from 0 to 1 and
multiplying by 10 to get random real numbers from 0 to 10, then converting to integer. And back to a
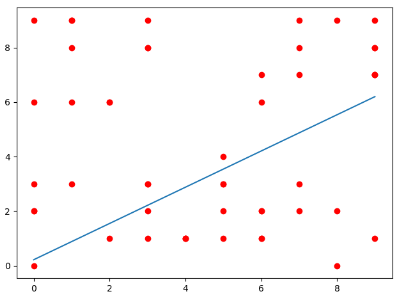
numpy array. Then, we’ll create an object of our class and call the fit function and set graph=True
to visualize the data. Here's the result. We can also run l.predict() to pass data
through our
hypothesis.
                    import numpy as np

                    from ml.linear_regression import LinearRegression

                    # Randomly generating the data

                    x = np.array(list(map(int, 10*np.random.random(50))))

                    y = np.array(list(map(int, 10*np.random.random(50))))

                    l = LinearRegression()

                    l.fit(data=x, labels=y, graph=True)
Regression doesn't have to be a line. We can do quadratic, cubic, quartic, exponential, logarithmic or any function. It’s basically the same thing as linear regression, but instead of using a line, we use another function.
Let’s move on to classification. First I want to talk about activation functions, the most popular activation function is the sigmoid function which is defined like this. What makes it special is the fact that it’s always between 0 and 1.

The first classification algorithm I want to talk about is logistic regression. Imagine you want to classify a flower as an Iris or not based on the size of the sepal and the size of the petal. Our data would have two features for the sizes and 1 or 0 for our y based on if the flower is an iris or not. Our hypothesis can look like $\sigma(\Theta_0 + \Theta_1 x_1 + \Theta_2 x_2)$. What the sigmoid lets us do is make our hypothesis output a probability of whether our flower is a Iris or not. We can set a threshold, say 0.5 where if the hypothesis outputs above or equal to 0.5, its an Iris and if is below 0.5 its not. Now, what we need to do is define our cost function. Then, we can use a minimizing algorithm like gradient descent to get our model. Instead of Mean Squared Error, which is what we used for linear regression, we will use something called cross entropy, which looks like this. This is how we can define it. It’s defined as $-log(h(x))$ if y is 1 and $-log(1-h(x))$ if y is 0. This can be condensed to this. We can now use gradient descent to find the optimal values for theta.
Now, lets go over some code. First let’s import the required libraries. Then, we create our random dataset, that can be split over the line $y=x$, after that we fit the model, and graph it. We can also test for accuracy.
                    from ml.logistic_regression import LogisticRegression

                    import matplotlib.pyplot as plt

                    from ml.random import yx2features

                    from ml.graph.lr import scatter_two_features, plot_line


                    data, labels = yx2features()


                    lr = LogisticRegression(features=2)

                    lr.fit(data=data, labels=labels, graph=True, lr=0.01, steps=200, to_print=False)


                    w, b = lr.get_values()


                    scatter_two_features(data, labels)

                    plot_line(w, b)

                    plt.show()


                    lr.test(data=data, labels=labels)
The next classifier I’m going to be going over is probably the most powerful one. You’ve probably heard about it, it’s called a neural network. Basically, it tries to mimic a human brain by using layers. You can learn the maths behind it here. You don’t need to know the math behind it to use it but it does help a lot. A neural network takes multiple inputs and can output multiple probabilities for different classes. Let’s say I want to classify a handwritten digit. I would have a image and input the pixel values into the neural network and output 10 different probabilities for each of the numbers from 0-9. Then I would select the highest probability and say that it’s that certain number. The way a neural network ‘learns’ is by looking at how wrong it was for each training example and adjust itself accordingly. We can use several activation functions for the inner layers, but the most common these days is ReLu which looks like this.

Now, let's build a handwritten digit classifier. First we import the required modules. Then, we create the object, specifying how many neurons we want in the middle layers and our activation function. Then, we can train it using out data, and then test it. We get an accuracy of about 92%, which may not seem bad, but that 8% makes up for a large amount of error. We can do better.
                    from ml.nn import NeuralNetwork

                    from ml.activation import relu

                    from tensorflow.examples.tutorials.mnist import input_data


                    mnist = input_data.read_data_sets("MNIST_data/", one_hot=True)


                    n = NeuralNetwork(

                    layers=[20],

                    inp=784,

                    activation=relu,

                    out=10,

                    )


                    # n.load("model.pkl")


                    n.fit(50000, data=mnist.train.images, labels=mnist.train.labels, lr=0.0001, graph=True)


                    n.test(mnist.test.images, mnist.test.labels) # 91.52%, can be better!


                    # n.save("model.pkl")
There are many different types of neural networks but the one I’m going to talk about now is a convolutional neural network. This type of neural network is very effective on images, which is good for our case. It uses a filtering method that makes it very effective. Let’s see how we can use it. First, I’m going to import the modules, then make the object, setting a few constants. After that, I’m going to train the model and test it. Based on how long we train it for, we can get an accuracy of around 98%, which is way better.
                    from ml.cnn import CNN2D

                    from ml.data import mnist

                    from ml.data import get_predicted_value


                    c = CNN2D(

                    layers=2,

                    inp=784,

                    out=10,

                    kernel_size=[5, 5],

                    pool_size=[2, 2],

                    filters=[32, 64],

                    dimensions=[28, 28],

                    )


                    c.fit(data=mnist.train.images, labels=mnist.train.labels, lr=0.001, epochs=200, save_path="./model")


                    # c.load("./model")


                    c.test(data=mnist.test.images[0:100], labels=mnist.test.labels[0:100])


                    predicted = c.predict(mnist.test.images[0], transpose=True)


                    print("Predicted Value: {}".format(get_predicted_value(predicted['probabilities'])))

                    print("Actual Value: {}".format(mnist.test.labels[0]))
Unsupervised learning
Although there are many different unsupervised learning algorithms, I’m only going to cover one today, that is K-Means. This is a clustering algorithm, that can cluster a dataset into K different clusters, hence the name K-Means. It’s an iterative algorithm and not hard to wrap your head around, so I’ve left some links below to learn about the maths behind this algorithm. Basically, you want to use K-Means if you have an unlabelled dataset which you want to separate into different groups.
In this example, I’m going to cluster a randomly generated dataset into 4 different groups, so K=4. First let’s import the required modules, create the dataset, train and then graph.
                    from ml.k_means import KMeans

                    from ml.random.kmeans import create_dataset


                    N = 1000

                    K = 4

                    data, y = create_dataset(N)

                    k = KMeans(K, N)

                    centers, assign = k.fit(points=data, cluster_assignments=y, epochs=10000, graph=True)
By the way, if you want to look at any of this code, feel free to go here
Conclusion
So, what’s next? A lot, actually. I’ve barely scraped the surface of machine learning. The goal of this video was to give an overview of some popular algorithms in machine learning. It could show you if you find this topic interesting or not. If you are interested, I recommend trying tensorflow, and learning how exactly each of the algorithms mentioned work. You can also try various other algorithms like SVMs Recurrent Neural Networks, LSTMs, etc. One field that I didn’t cover is reinforcement learning, which I could make a video on. Reinforcement learning leads to a lot of the major headlines you see on the news, like OpenAis Dota players and Google’s DeepMind projects. That’s all I have for you know, thanks for reading!